Cross-filtering dashboards
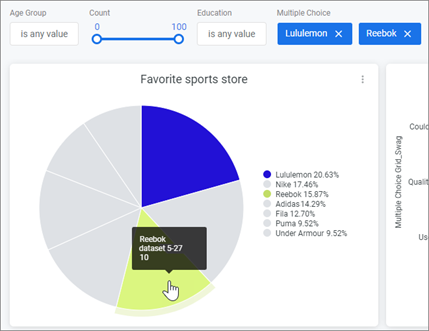
Cross-filtering allows interaction with the dashboard data to see how metrics affect each other.
A data point can be clicked in one dashboard, and all other dashboard tiles automatically update to filter based on that value.
Note: The following visualizations are not supported:
- Single value charts
- Single record charts
- Map charts using Plot options
- Visualizations using grid layouts
Use cross-filtering
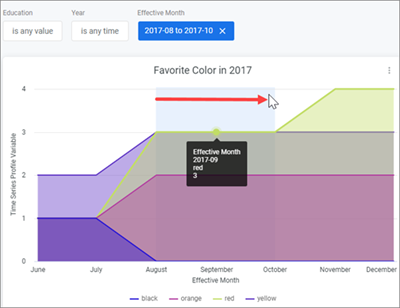
Cross-filtering a range selection
Note: In order to use the range selection the following requirements
must be met:
- The dashboard is a time series dashboard.
- The tile is a line, area, or scatterplot visualization.
In a supported visualization tile, click one end of the range,
and hold and drag to the end of the range.


Note: Additional data points cannot be added from the same tile
when using a range selection.
Result: When you release your click, the cross-filter appears
at the top of the dashboard and other tiles are now filtered using that range.
Removing cross-filters
Use one of two ways to remove a cross-filter from the dashboard.
Using cross-filtering with standard filters
A dashboard can contain both cross-filters and standard filters. Both appear at the top of the dashboard with a few exceptions. Cross-filters are different from standard filters in a few ways. Cross-filters:
- Appear after standard filters and are dark blue.
- Can not be customized visually the same way standard filters can.
- Are not visible to others when a dashboard is shared.
- Are not saved to a dashboard. Once you navigate away from the page, the cross-filter is cleared.
- Are not applied to dashboard downloads and schedules.
Note: If a cross-filter is created with the same dimension the standard
filter is using, the standard filter value cannot be changed until the
cross-filter is removed.

