Pivoting dimensions
Pivoting a field enables you to turn a selected dimension into several columns.
When you pivot a field, it creates a matrix of your data similar to a pivot table in spreadsheet software, or a crosstab report. This is useful for analyzing metrics by different groupings in your data, such as getting counts categories. When you pivot on a dimension, each unique possible value becomes its own column header in the Data table. Any measures you have selected are repeated under each column header. For example, count of Promoter, Passive, and Detractor for a Net Promoter Score1 (NPS) category dimension.
Pivoting a dimension is useful in situations where you have a question involving one dimension by another dimension. For example, to view NPS category by region, pivot the Region field.

Pivot a dimension
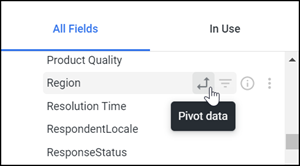
You can pivot a dimension either in the field picker or in the data table.
Multiple dimensions are often easier to look at when you pivot one of the dimensions horizontally. Each value in the dimension will become a column. Up to 200 pivoted values for a dimension are supported.

