Introduction to dashboards

What is a configurable dashboard?
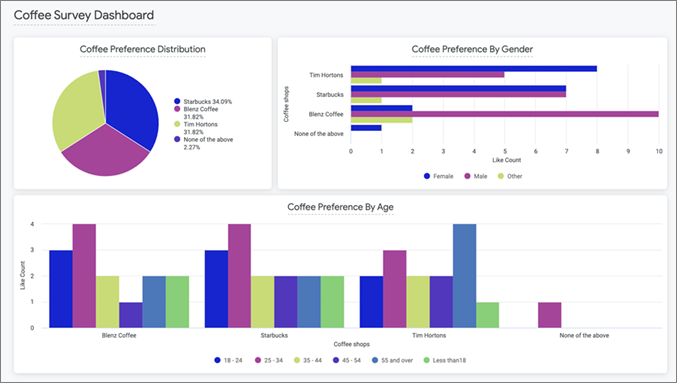
Configurable dashboards group charts and text and present them on a single web page. Dashboards are shareable reports that answer a set of related questions. A dashboard is comprised of a set of tiles arranged on a grid. These tiles can be visualizations (charts), text, or links.
How to create a dashboard
Open the Analytics app and click Create a Dashboard on the Home page. Give the dashboard a name, configure access controls, and select the dashboard template and data to use.
Duplicate a dashboard
If you want to create a dashboard based on the same data as an existing dashboard, or you want to test changes to an existing dashboard without affecting the original, you can duplicate a dashboard.
To duplicate a dashboard, click the Options menu on the Dashboard page and select Duplicate.
Adding tiles to a dashboard
Add tiles to your dashboard by opening it in edit mode, clicking the Add button, and selecting the type of tile to add.
There are three types of tiles you can add to your dashboard:
- Visualizations: These are the tables and charts you use to display the data your dashboard is summarizing to answer business questions.
- Text: These tiles can be used to add titles, group visualization tiles into sections, or provide explanatory information. You can use Markdown syntax to format the text.
- Button: These tiles can be used to add links to external information. Users click on the button and are redirected to the web page or other resource you specify.
Arranging tiles
A dashboard is made up of tiles that you can move around and resize, as necessary. Move any tile, or dashboard filter, by hovering over the item and then using the 6-dot menu to drag and drop the item to its new location. Resize tiles by dragging and dropping from the bottom right corner. Use the grid that is temporarily displayed to align the items you are moving or resizing.
Finding dashboards
All of the dashboards you have access to are listed on the Dashboards page. You can locate a dashboard by typing all or part of the name in the Search text box, sorting by any of the column headings with arrow icons next to them, and by paging through the table listing your dashboards.
You can also make dashboards easier to find in the future by selecting important or frequently used dashboards as favorites, so you can access them directly on the home page.
Publishing and sharing dashboards
When your dashboard is complete you can make it available to other users of Analytics by publishing it. You determine who has access to it by specifying the access control settings. If you want to share the dashboard with people in your organization or stakeholders that do not have access to Analytics, you can create a public link to the dashboard and share it with them via the link. Alternatively, you can email the dashboard to stakeholders either immediately, or on a predefined schedule.