Crosstab: Best practices
Follow best practices for setting up a crosstab report to leverage your data.
Crosstabs are best used to find correlations in quantitative data using a two dimension table. Find out key questions such as how does your customer's product opinion change based on their age or gender and use that information to switch target audiences.
| Example |
|---|
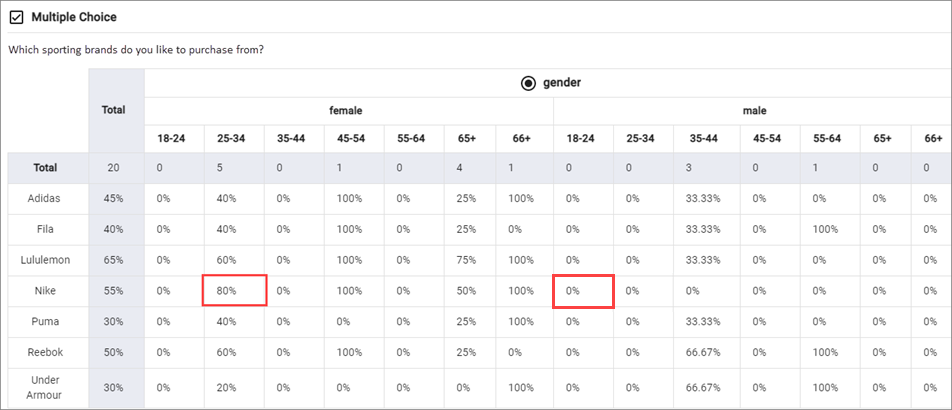
For example, you are an analyst for a sporting goods company selling different brands of work out gear. You want to find out if the customers purchasing Nike gear are young adult Males based on previous observations or if there is any other correlations. Then, you can analyze the data so you can stock more products from that brand. To get started we will need to know the demographic of your customers and which sport brands they like to purchase from. Let's presume you do not know the demographic information of the participants you want to analyze. First, you would want to create a survey that asks the question you want to know, such as a Multiple Choice question asking "Which sporting brands do you like to purchase from?". Then, create two Single Choice questions called Age and Gender. After gathering enough responses, you create a dataset containing the
survey.
Note: In another scenario where you already know the demographic
information about your participants (from profile variables), you can select
profile variables during this step.
Now you are ready to create and view a crosstab report. After nesting the Age and Gender questions, find the Multiple Choice question in the report. From your crosstab report, you find that a majority of your customers who purchase Nike gear are actually Females between the age of 25-34.  |
Surveys
- A survey should contain any of the supported question types to best leverage the report but there is no wrong way of constructing the survey.
- If you do not have age and gender information about your participants, you can always create a survey question asking for that information. This is especially important, if a live activity link or ad-hoc survey is used where demographic information of your participants may not be known since they are not members. For example, if you add the profile variable "Location" to your report and you do not know the participant's "Location" information, your crosstab can be empty if you try to nest that column.
Datasets
Set one survey as a primary source in a dataset and add key fields such as demographic data as profile variables.
Crosstabs
- Use profile variables as nested columns.
- The best types of data to use as nested columns, and for analyzing crosstabs, are any types of demographic data. Some examples of demographic data include Age, Gender, and Location.
- It is recommended to have at least one or two levels (child and grandchild) of nested columns for an ideal crosstab report.