Examining significance test results in a crosstab
When applying a significance test, the table in the crosstab changes to reflect the results.
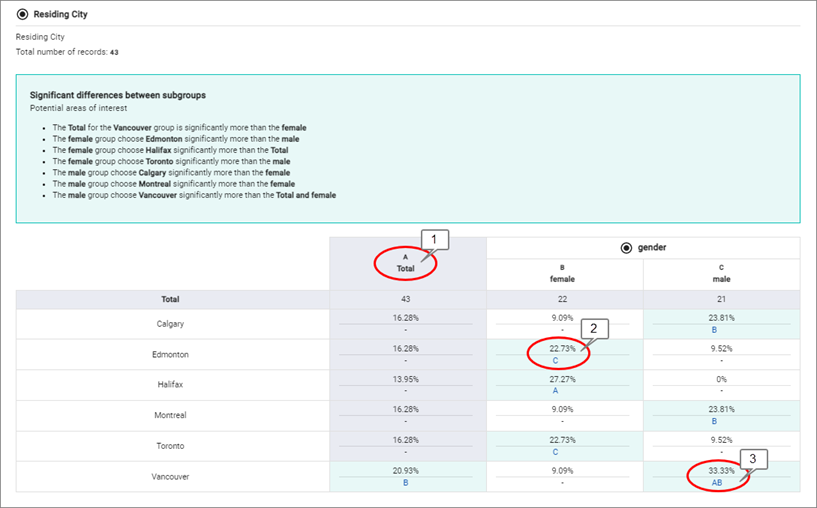
The following image shows the results of a significance test.

The following table describes how to interpret the results of a significance test.
| Number | Description |
|---|---|
| 1 | Each column is given an alphabetic label. |
| 2 | A highlighted cell indicates that the cell value is significantly different from another cell value. |
| 3 | A highlighted cell that contains an alphabetic label indicates the cell value is significantly larger than the value found in the alphabetic label. For example, the value in column D (33.33%) is significantly higher than both column A (20.93%) and B (9.09%). |