Download a dashboard

Save your dashboard as a PDF or a CSV.

Note: If a Row Limit is specified for a visualization, data included in the download will only include rows up to the row limit. If you want to include additional rows in your download, you can update the row limit to include up to 5000 rows.
  1. Open the Analytics app and on the analytics menu, click Dashboards. Then, select a dashboard from the list.
  2. In an existing dashboard, click the Options button on the top right of the page and then, click Download.
  3. In the Format section of the dialog, select an output format for the dashboard from one of the following options:
    • PDF: Exports as a PDF attachment.

      The following options are available when PDF is selected.

      Options Description
      Paper Size Specify the size and orientation of the dashboard.
      Note: Large visualizations or groups will need to be resized to fit on a PDF page.
      Expand tables to show all rows Displays all the rows in a table rather than what is shown in the tile thumbnail.
      Note:
      • The Data table of a tile is used when exporting.
      • This is only available for PDF formats.
      Arrange dashboard tiles in a single column Displays the dashboard tiles in a single vertical column.
      Open in Browser The dashboard is opened in the respective format select in the browser.
    • CSV: Unformatted data from the dashboard is downloaded as a zipped CSV file.
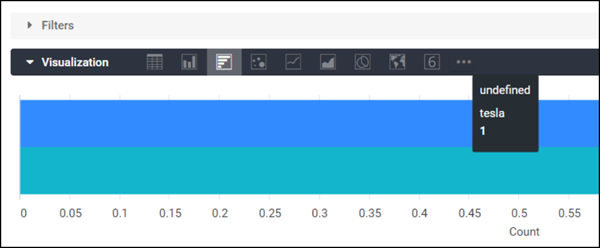
      Note: If your dashboard contains any undefined values, you will not be able to download the dashboard as a CSV file. Remove or correct the undefined values before downloading your CSV file.
  4. Click Download.