Selecting dimensions and measures for your visualization
The fields from your data sources will be divided into dimensions, which are qualities or attributes of your data, and measures, which are aggregate calculations applied across one or many rows of data.
A dimension corresponds to a question from a survey, a column in a CSV file, or a field in a data source. For an activity, the dimension name is the question name, and each row contains a value with the answer. When you select a dimension, only the unique values are displayed. When you select multiple dimensions the unique combinations of the selected dimensions are displayed. Selected dimensions are displayed in blue in the field picker and Data panel.

Measures are calculations performed across multiple rows of data. Measures are aggregates of dimensions, which allow you to easily calculate values such as count, sum, or averages across your data. For example, if you want to calculate how many of something look for a measure with count in the name. You can choose Count without a dimension to count the number of records in a data source. Selected measures are displayed in orange in the field picker and Data panel.

Combining dimensions and measures
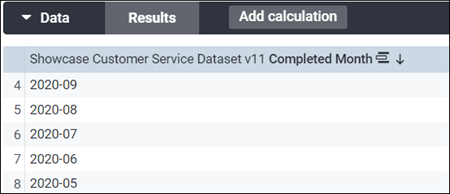
When working with visualizations, you will often need to combine dimensions and measures to answer more complex questions. For example, combining the Completed Month dimension with the NPS Score measure enables you to display the monthly changes to NPS scores over time.

In some cases, you may also need to pivot a dimension to shape the data to meet your needs. For example, to show the counts for each NPS Category (Promoter, Passive, Detractor) in a Column or Bar chart, you need to pivot the Net Promoter Score_Category dimension. For more information on pivoting, see Pivoting dimensions.

Choosing Explores
Explores are containers for the dimensions and measures from a data source or user-defined field.
- If only profile variables are selected, an Explore named Profile Variables is created.
- Explores for surveys have the same name as the survey. Then contain all of the dimensions and measures for the survey questions, any profile variables that have been selected for the dashboard, and any Scalar Fields that are based on questions in the survey.
- If one or more mapping fields are added, one Explore named Mapping Fields is created. The mapping field Explore will also contain all profile variables, any Scalar Fields based on the Mapping Fields, and the system fields for Mapping Fields.
Some specialized Explores are also created for certain types of data. For example, Text Analytics dashboards have a second Explore named Text Analytics Responses, and time series profile variables are added to a second Explore named Time Series Profile Variable. Select from these Explores to use these specialized dimensions and measures in your visualization tiles.