Implement the t-test for NPS samples
You can add the t-test to your visualization to compare the Net Promoter Scores (NPS) of two samples.
-
In the Field Picker, select the following measures to include in
the Data panel:
- Count
- [NPS field name] > NPS Score
- [NPS field name] > Std Dev of NPS Score
- [NPS field name] > Var of NPS Score
The following four steps create table calculations for each of these measures, for use in subsequent table calculations and so that visualizations can easily be duplicated. After you create these table calculations you can hide the fields for these measures in the Data panel.
-
Create a table calculation for
Count:
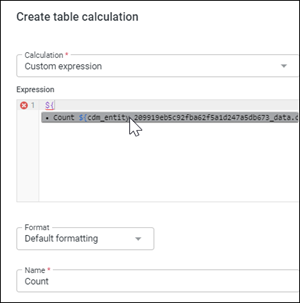
- In the Field Picker, select Add > Table Calculation.
-
Enter
${ and then select the
Count measure from the drop-down list.

- In the Name text box, enter Count as the field name.
- Click Save.
-
Create a table calculation for
NPS Score:
- In the Field Picker, select Add > Table Calculation.
- Enter ${ and then select the NPS Score measure from the drop-down list.
-
In the
Name text box, enter the field name.
For example: NPS Score
- Click Save.
-
Create a table calculation for
Standard Deviation:
- In the Field Picker, select Add > Table Calculation.
- Enter ${ and then select the Std Dev of NPS Score measure from the drop-down list.
-
In the
Name text box, enter the field name.
For example: STD
- Click Save.
-
Create a table calculation for
Variance:
- In the Field Picker, select Add > Table Calculation.
- Enter ${ and then select the Var of NPS Score measure from the drop-down list.
-
In the
Name text box, enter the field name.
For example: Var
- Click Save.
-
Create a table calculation for
Period over period change (PoP%):
- In the Field Picker, select Add > Table Calculation.
-
Copy the table calculation template into the
Expression text box.
if(${wave}=1 # 1 is equal to the period number # This can alternatively be equal to a sample_group name # ----- Begin second pivot section ---------------------------------- # Remove this section if you aren't including a second pivoted field OR ${second_pivot}!=pivot_offset(${second_pivot}, -1) # what the previous line of code is doing is that given the current column # like "Canada", return true if the column before's value is not "Canada" # ----- End second pivot section ---------------------------------- ,null, (((${nps_score}+100)- (pivot_offset(${nps_score}, -1)+100)) / (pivot_offset(${nps_score}, -1)+100))) # the -1 arguments above are taking the previous value -
Replace
${wave}in the first line with the period, sample group or wave dimension in your data. - In the Format drop-down list, select Percent.
- In the Decimals text box, enter 0.
-
In the
Name text box, enter the field name.
For example: PoP%
- Click Save.
-
Create a table calculation for the
Minimum Sample Size T-test:
- In the Field Picker, select Add > Table Calculation.
-
Copy the table calculation template into the
Expression text box.
# Using 95% confidence interaval (1.96) and Power of 0.8 (~0.84) ( (2* power((1.96+0.84),2) * (power(${std_1},2)/${count_1} + power(pivot_offset(${std_2},-1),2)/pivot_offset(${count_2},-1) )) / (power((${sample1_nps} - pivot_offset(${sample2_nps},-1)),2)) ) -
Replace all instances of
${std_1}and${std_2}with the${std}table calculation,${count_1}and${count_2}with the${count}table calculation, and${sample1_nps}and${sample2_nps}with the${nps_score}table calculation. -
In the
Name text box, enter the field name.
For example: Minimum Sample Size T-test
- Click Save.
-
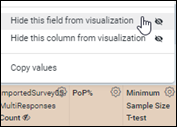
In the
Data table, click the gear icon for the
Minimum Sample Size T-test column and
select
Hide this field from visualization.

-
Create a table calculation for the
T-test:
- In the Field Picker, select Add > Table Calculation.
-
Copy the table calculation template into the
Expression text box.
# As the the sample sizes cause the degrees of freedom to far exceed 100, # we can assume +/- 1.96 for the Critical T-Value for a 2-tail hypothesis. (${sample1_nps} - pivot_offset(${sample2_nps},-1)) / sqrt( ${sample1_var_1}/${sample1_count} + pivot_offset(${sample2_var_2},-1)/pivot_offset(${sample2_count},-1) ) -
Replace all instances of
${sample1_nps}and${sample2_nps}with the${nps_score}table calculation,${sample1_var}and${sample2_var}with the${var}table calculation, and${sample1_count}and${sample1_count}with the${count}table calculation. -
In the
Name text box, enter the field name.
For example: T-test
- Click Save.
-
Create a table calculation for the
Final T-test:
- In the Field Picker, select Add > Table Calculation.
-
Copy the table calculation template into the
Expression text box.
# The following if statement allows only Wave over Wave comparisons # between 2 different waves not countries. # The "wave" and "country" will change when assessing other comparisons. if(${Wave_Number}=1 # ----- Begin second pivot section ---------------------------------- # Remove this section if you aren't including a second pivoted field OR ${second_pivot}!=pivot_offset(${second_pivot}, -1) # what the previous line of code is doing is that given the current column # like "Canada", return true if the column before's value is not "Canada" # ----- End second pivot section ---------------------------------- ,null, # The below if statement requires the sample size for each sample to meet # a minimum sample size in order to calculate the t-test score if(${sample1_count} < ${minimum_sample_size_t_test} OR pivot_offset(${sample2_count}, -1) < ${minimum_sample_size_t_test},null, # Calculate t-test score if the above if statements are passed ${t_test})) -
Replace all instances of
${Wave_Number}with the Period or Wave dimension, and${sample1_count}and${sample1_count}with the${count}table calculation. - In the Format drop-down list, select Decimals.
- In the Decimals text box, enter 2.
-
In the
Name text box, enter the field name.
For example: Final T-test
- Click Save.
- Optional:
Create a table calculation for
T-test Significant:
- In the Field Picker, select Add > Table Calculation.
-
Copy the table calculation template into the
Expression text box.
if(is_null(${final_t_test}),
  null,
  if(abs(${final_t_test})>=1.96,
  1,0))