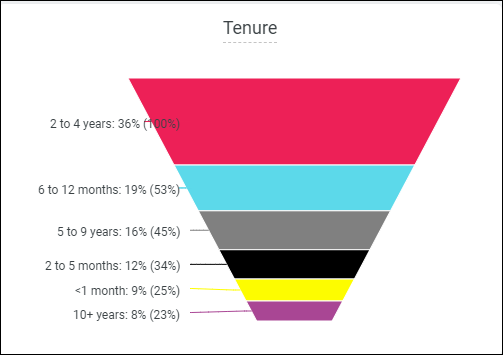
Funnel visualization
Use this visualization type to display sequential stages.
The following options are available under each tab.
Tip: Customize and edit the
selected visualization type in the
Edit Tile dialog box by clicking
Edit.
Axes
| Options | Description |
|---|---|
| Label Left Axis | Enables a text box to add a label to the left axis. |
| Label Right Axis | Enables a text box to add a label to the right axis. |
Bars
| Options | Description |
|---|---|
| Collection | Select from a group of pre-selected colors. |
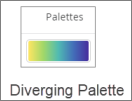
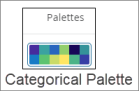
| Palette |
Choose one of several existing palettes or create a custom palette in the Custom tab. The following options are available:
Note:
|
| Reverse colors | Reverses the palette and applies colors at
the:
|
| Smoothed Bars | Connects the outer edge of each bar in the funnel chart with the bar above and below it. |
| Orientation | Specify whether the data is drawn from table rows or columns. The Automatic option chooses the data based on where there is the most data. |
| Label Scale | Specify the size of the labels on each side
of the chart. The following options can be entered:
|


Labels
| Options | Description |
|---|---|
| Label Position | Choose where data labels appear on the
chart. The following options are available:
|
| Percentage Type | A percentage value is added for each bar. This is determined by comparing the bar's value to the largest value in the chart or comparing the previous bar in the chart. |
| Percentage Position | Choose where bar percentage appears on the
chart. The following options are available:
|
| Value Position | Choose where data values appear on the
chart. The following options are available:
|
| Color Label | Set a custom color for the label or
percentage.
Note: Inline labels will appear in the color chosen and labels
on the sides of the chart will appear 40% darker than the selected color.
|