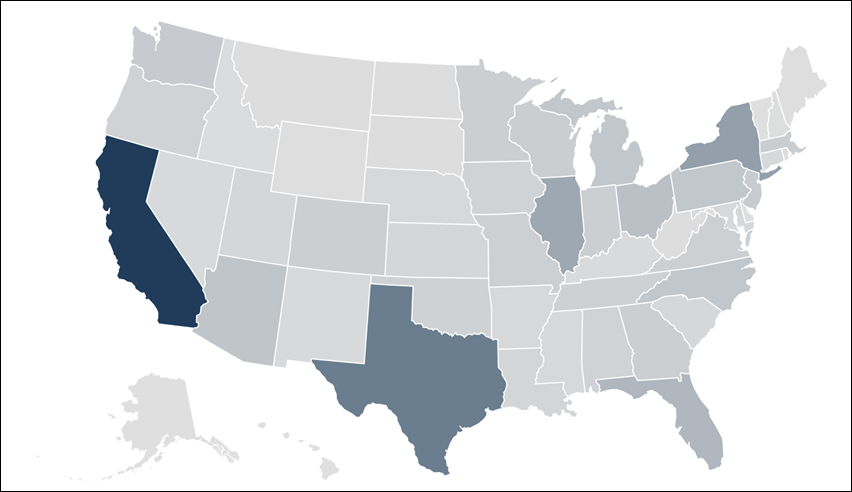
Static Map (Regions) visualization
Use this visualization type to display regional data.
Note: Map visualizations work with profile
variables that meet all of the following requirements:
- The profile variable is named "Country".
- The values are either full name of the country or the 2-3 country code.
It is not required to be case sensitive.

The following options are available under each tab.
Tip: Customize and edit the
selected visualization type in the
Edit Tile dialog box by clicking
Edit.

Map tab
Depending on the options you select in the Map field, the following options are available:
| Options | Description |
|---|---|
|
Data is automatically grouped automatically or by US states. |
|
Data is automatically grouped by zip codes
of the region selected. The following option is available when you select any
of the options in the
Map field:
|
| World | Data is grouped by country. The following
options are available when you select
World:
|
| Custom | Enables you to define the map using
TopoJSON. The following options are available when you select
Custom:
|
Style tab
| Options | Description |
|---|---|
| Colors | Defines the color of magnitude of each map
region. This field takes a comma separated list of one or more color values.
Values can be hex codes (for example,
#b79d0f) or
CSS color names (for example,
mediumblue).
Note: If multiple colors are added in the field, colors will be
assigned to each data point in order. For example, the first data point in the
table will be the first color, and so on.
|
| Quantize Colors | Determines if the colors of a map regions
chart is either:
|
| Empty Region Color | Displays a color for any region on the chart that does not appear in the data. |
| Outer Border Color | Sets the color of the overall map border. |
| Inner Border Color | Sets the border color of each map region. |
| Outer Border Width | Sets the width of the overall map border. |
| Inner Border Width | Sets the border width of each map region. |
| Show Full Field Name in Tooltips | Determines if the name is displayed in tooltips when hovering over a map region. |