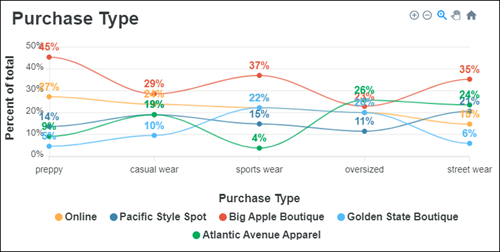
Line (Modern) visualization
Use this visualization type to display continuous data over time with a modern look.
Note: Custom fields are not
supported in modern visualizations.
Tip: Customize and edit the
selected visualization type in the
Edit Tile dialog box by clicking
Edit.
Series
| Options | Description |
|---|---|
| Line Colors |
Choose one of several existing palettes or create a custom palette in the Custom tab. The following options are available:
|
| Show Value Labels | Choose to show or hide the value labels for each plotted point. |
| Show Target | Choose to show or hide the target value. The target is displayed as a dashed line in the Target Color. |
| Target Value | Specify the target value for the measure. |
| Target Color | In the
Palettes tab, select a color from the
current palette, or click the
Custom tab and select a custom color.
The following options are available:
|


Titles
| Options | Description |
|---|---|
| Graph Title | Enter the title to display above the visualization. |
| Custom x-axis Title | Enter a title to override the x-axis title. |
| Show x-axis Title | Choose to show or hide the x-axis title. |
| Custom y-axis Title | Enter a title to override the y-axis title. |
| Show y-axis Title | Choose to show or hide the y-axis title. |
| Hide Legend | Choose to show or hide the legend. |
| Legend Position | Select Bottom to display the legend below the visualization, or Right to display it to the right of the visualization. |