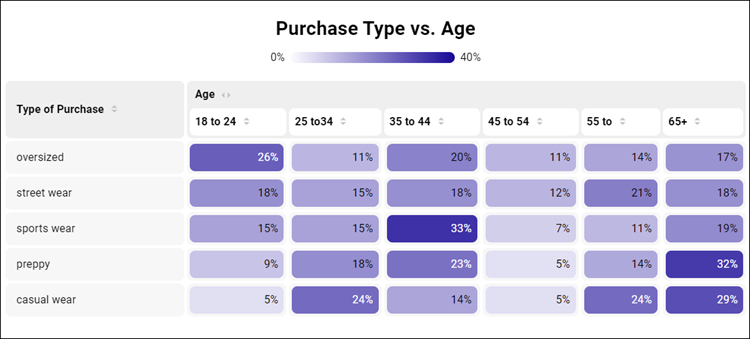
Table (Modern) visualization
Use this visualization type to display raw data values with a modern look.
Note: Custom fields are not
supported in modern visualizations.

Tip: Customize and edit the
selected visualization type in the
Edit Tile dialog box by clicking
Edit.

Columns
Each column included in the table is listed. Enter a title for each column where you want to customize the default title. Otherwise, the default title is used.
Legend
| Options | Description |
|---|---|
| Gradient Start Color | Select the color to start the gradient with. |
| Gradient End Color | Select the color to end the gradient with. |
| Max Value for Gradient (%) | Enter the percentage value where the Gradient End Color becomes solid. |
| Min Value for Gradient (%) | Enter the percentage value where the Gradient Start Color becomes solid. |
Pivot
The Pivot tab is included if the visualization has at least one pivoted column.
| Options | Description |
|---|---|
| Pivot Variable Name | Enter a custom label for the pivoted column. |
Title
In the Title text box, enter the title for your table. You must enter a value to override the default title.