T-test
Use the t-test to determine if the difference between two samples are statistically significant or due to chance.
The result of a t-test is a t-value which reflects the size of the difference between the two samples relative to the amount of variation within each group. The higher the t-value, the more likely it is that the difference between the two groups is not just due to chance.
When you perform a t-test, you also specify a p-value threshold, which is usually set at 0.05. If the p-value is less than 0.05, it means that there is less than a 5% chance that the difference between the two groups is due to chance alone, which means the difference is statistically significant.
Higher t-values indicate that a large difference exists between the two samples. The smaller the t-values, the more similarity exists between the two sample sets.
| Minimum sample size formula |
|---|
When using the t-test it is important to ensure that the data included meets the minimum sample size for the test, which is defined by the following formula: |
| Variable | Description |
|---|---|
| n | Minimum sample size. |
| z_alpha/2 | The confidence interval. This can be adjusted. Usually the confidence is 95% (1.96). |
| z_beta | Power. This can be adjusted. Usually the confidence is 0.8 (0.84). Power is the probability of a hypothesis test of finding an effect if there is an effect to be found. |
| std_1, std_2 | The standard deviation of each sample. |
| m_1, m_2 | The mean of each sample. |
| c_1, c_2 | The count of each sample. |
In the above formula,
(std_1)^2/c_1 + (std_2)^2/c_2)) is summing up the
standard errors of each sample. We're using the standard errors of each sample
instead of their standard deviations because the standard error takes into
account the size of the sample, which means that it can be used to estimate the
variability of the mean in the population even if the standard deviation is
unknown. This is important because the standard deviation of a sample tends to
be an overestimate of the true population standard deviation when the sample
size is small.
In addition, if we use the standard deviation version of this
formula,
 n = (2 * (z_alpha/2 + z_beta)^2) * ((std_1)^2 + (std_2)^2)) /
			 (m_1 - m_2)^2
the result is that for a lot of comparisons, the minimum
sample sizes will be extraordinarily large in relation to the actual sample
size of each sample. This is especially apparent when we keep drilling down in
the fields because as we drill down, each sample's size will become smaller in
turn. This will result in comparisons that don't have T-tests results.
There are two variants of the t-test you can implement:
- Use the t-test for means when comparing the means of two samples.
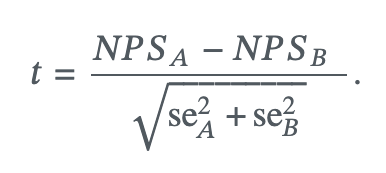
- Only use the t-test for NPS when comparing the NPS®1 scores of two samples.
T-test for means
A two-sample t-test is a statistical test used to determine whether the means of two independent groups are significantly different from each other. This test is commonly used when we want to compare the means of two different populations or groups, such as the mean heights of men and women, or the mean test scores of two different schools.
In a two-sample t-test, we compare the means of the two groups and determine if the difference between them is larger than what we might expect by chance. The null hypothesis for the test is that there is no difference between the means of the two groups, while the alternative hypothesis is that there is a significant difference.
One example use case of this is determining if there the change in CSAT scores between 2 different Periods is significant, assuming that the CSAT scores are normally distributed. This can influence business decisions in order to keep the recent CSAT score within margin of the target score or improve the recent CSAT score against the target.
| T-test formula |
|---|
|
| Variable | Description |
|---|---|
| t_score | The t-score. |
| m_1, m_2 | The mean of each sample. |
| std_1, std_2 | The standard deviation of each sample. |
| count_1, count_2 | The count of each sample. |
T-test for Net Promoter Scores
The Net Promoter Score℠ (NPS®) method reduces the data to a set of −1,0,1 values (representing "Detractors," "Passives," and "Promoters," respectively). The NPS is the mean value. However, when calculating the t-test between two survey samples, we need to account for margin of error (MOE) of each survey, therefore the t-test calculation will be different from the conventional way of calculating t-test between two means of different samples.

- NPS Score
(
NPS) as is, no adjustments needed. - Sample variance
(
var) as is, no adjustments needed, in other words, std^2 is essentially the standard deviation squared. - Sample size
(
n) as is, the count of each sample. - Standard Error
(
se^2) will be as follows:var/n. - T-Test(
t):t = (nps.A - nps.B) / sqrt(se^2.A + se^2.B). Ais sample A.Bis sample B.