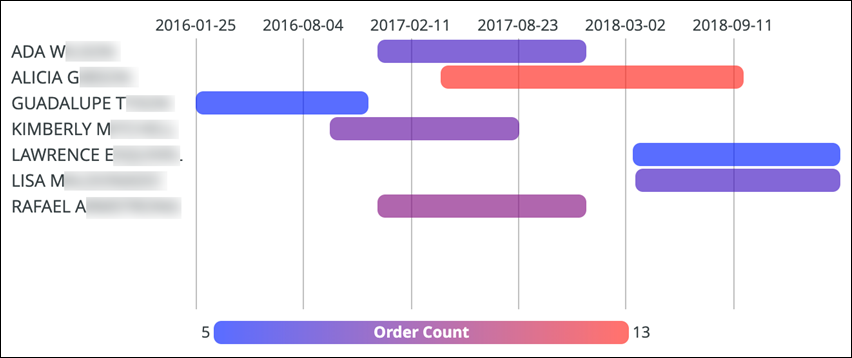
Timeline visualization
Use this visualization type to display the progression of time.
The following options are available under each tab.
Tip: Customize and edit the
selected visualization type in the
Edit Tile dialog box by clicking
Edit.
Options
| Options | Description |
|---|---|
| Collection | Select from a group of pre-selected colors. |
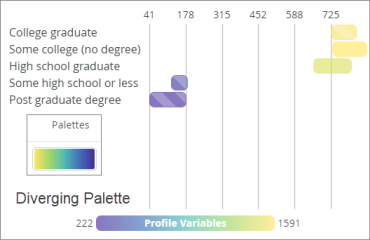
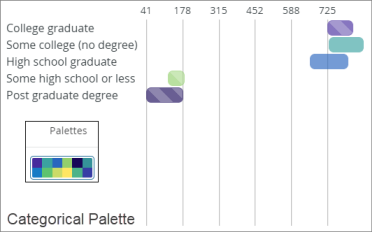
| Palette |
Choose one of several existing palettes or create a custom palette in the Custom tab. The following options are available:
Note:
|
| Reverse colors | Reverses the palette and applies colors at
the:
|
| Group Bars by Label | Determine whether the visualization displays each bar in its own row or all in the same row. |
| Label Size | Specify the size of the labels on the chart. |
| Value Format | Specifies the format of the value. For more information, see Numeric formatting for visualizations. |
| Show Legend | Toggles the appearance of the legend at the bottom of a visualization. |