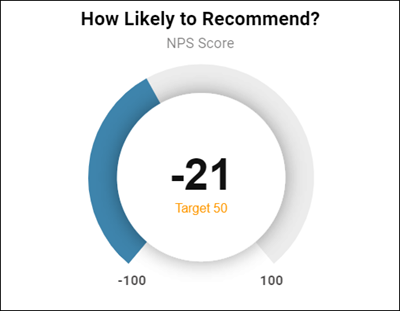
Gauge (Modern) visualization
Use this visualization type to display a single value that measures progress toward a goal or key performance indicator (KPI) with a modern look.
Note: Custom fields are not
supported in modern visualizations.

Tip: Customize and edit the
selected visualization type in the
Edit Tile dialog box by clicking
Edit.

| Options | Description |
|---|---|
| Title | The title to display above the visualization. |
| Subtitle | The subtitle to display directly below the Title, and above the visualization. |
| Max Value | The maximum value for the measure used in the visualization. |
| Min Value | The minimum value for the measure used in the visualization. |
| Target | The target value for the measurement being displayed. |
| Gauge Colors |
Choose one of several existing palettes or create a custom palette in the Custom tab. The following options are available:
|
NPS® drill down
If the visualization shows NPS℠1 Score data, users can drill down by clicking the NPS Score value. Up to 500 rows are displayed with the following information:
- Date: The date the NPS response was recorded.
- Respondent Member ID: The unique ID for the member.
- Follow Up: The respondents' comments on the rating.
- Response Status: The status of the survey (Complete, Incomplete, etc.).
- Category: The NPS category of the response (Promoter, Passive, Detractor).
- Median of NPS Response: The NPS score.
For more information, see Drilling into NPS score visualizations.
1 Net Promoter, NPS, and the NPS-related
emoticons are registered U.S. trademarks, and Net Promoter Score and Net
Promoter System are service marks, of Bain & Company, Inc., NICE Systems,
Inc. and Fred Reichheld.


