Drilling into NPS® score visualizations
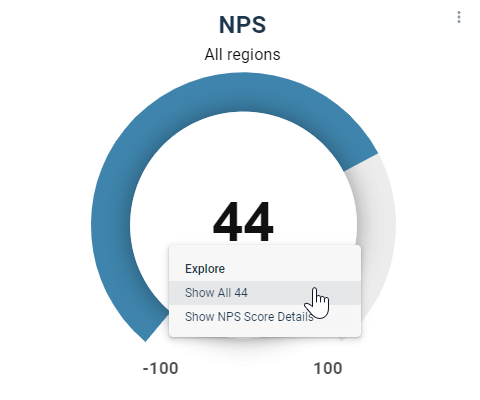
For visualizations that show NPS® Score data, you can click on a region or data point to drill down into the visualization.
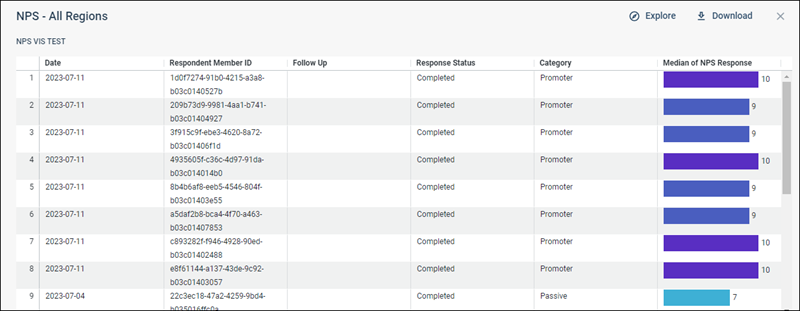
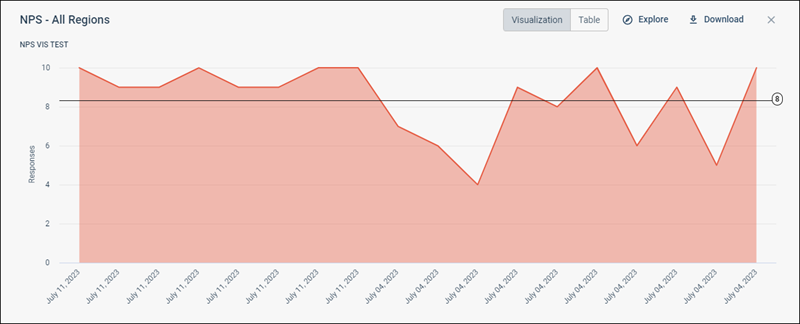
Drilling down enables you to view the details for a data point. In table visualizations, data points that you can drill down into display a dotted underscore when you hover over them. When you drill into a visualization, an overlay window appears displaying the data behind the data point. The overlay window also displays any filters applied.
The following visualization types support drilling into NPS®1 data:
1 Net Promoter, NPS, and the NPS-related
emoticons are registered U.S. trademarks, and Net Promoter Score and Net
Promoter System are service marks, of Bain & Company, Inc., NICE Systems,
Inc. and Fred Reichheld.


