Customize a crosstab report

Add columns a crosstab report to compare and analyze data.

Prerequisites:

Create a crosstab report

Note:
  • The User Agent respondent variable will not contain any data if used as a column.
  • In grid question types, a table containing a summary of the both column and rows answers is not available. Currently, only columns are displayed in crosstab reports.
  1. Open the Analytics app and on the analytics menu, click Crosstabs.
  2. On the Crosstabs page, click the name of a crosstab report.
  3. On the left of the page, under the Columns section, click Edit.
    Tip: If you close the Edit pane, click Expand to open it again.
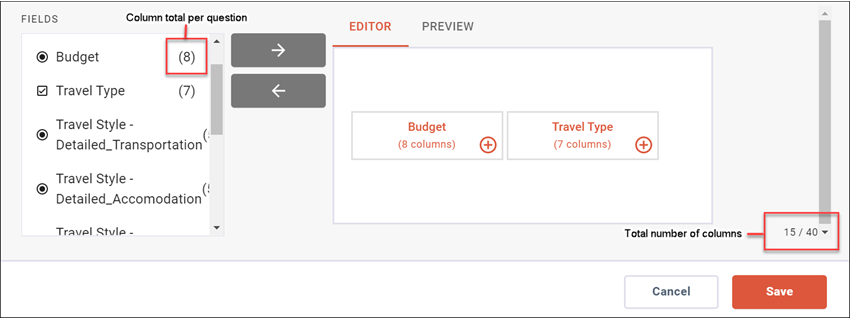
  4. In the Fields section of the Customize Columns dialog, select a question to be compared as a column.
    Note: A limit of 40 columns can be added. Each field has a number of columns and in total they can not surpass 40.
  5. Click the right arrow button to select it.
    Result: The selected field now appears in the Columns Preview section where you can view how the columns will look before it is applied.
  6. Optional: To remove the field, in the Selected section, click the question and then click the left arrow button.
  7. Click Save.
  8. Optional: In the Edit pane under Cells Display, click the drop down menu and select one of the following display options.
    • Percent
    • Count
    • Both
  9. On the top right of the page, click Refresh Dataset to see the latest data.
    1. In the Refresh Dataset dialog, click Confirm.

Nested columns can be added to the crosstab report to find similarities or differences between the data.