Create a survey and profile variable Classic Dashboard

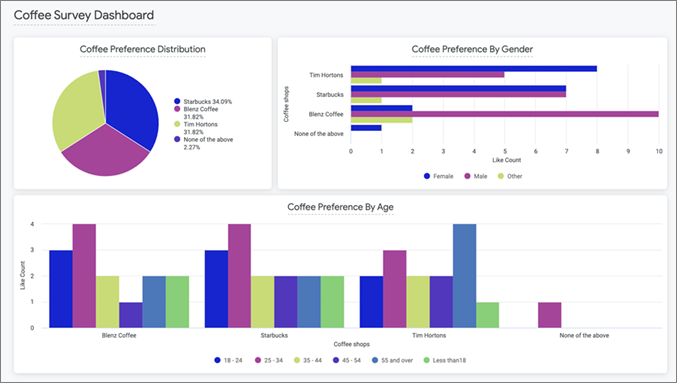
A dashboard containing both survey questions and profile variables can be created to analyze survey results better.

External data cannot be uploaded into a dataset to create a configurable survey response dashboard. However, the workaround is to upload external data as profile variables and use it to create a dashboard with both survey and profile variable data.

Create a dataset with activities and profile variables

Prerequisites:

Optional: Create profile variables with external data

  1. Open the Analytics app and on the analytics menu, click Datasets.
  2. Click New Dataset.
  3. Enter a name for the dataset and click Create.
  4. Click Add Data Source > Activity and select which activities to add to the dataset.
    1. Click Next.
    2. Select which fields to carry over from each activity.
    3. Click Done.
  5. Click Add Data Source > Profile Variable and select which profile variables to add.
    1. In the Dataset Type field at the bottom of the dialog, select Secondary.
      Note: This accounts for the overlap of participants who have also responded to activities so the dashboard can display the data accurately.

      For more information, see Add a dataset.

    2. Click Done.
  6. On the top right of the page, click Sync Dataset.

Create a configurable survey response dashboard

A configurable survey response dashboard uses a dataset to create the dashboard allowing use of both profile variables and activities to be represented on the dashboard.

Note:
  • The survey response dashboard will only reflect the dataset selected.
  • A survey response configurable dashboard can contain responses from multiple surveys and needs a dataset to be created. This is different from the survey dashboard which is predefined and can only be created from a single survey.
  1. Open the Analytics app.
  2. Create a new dashboard:
    • On the Home page, click Create a Dashboard.
    • In the Analytics navigation menu, click Dashboards and then click New Dashboard.
  3. Enter a name for your dashboard and click Next.
  4. In Set Dashboard Access Controls, specify which users can access the dashboard.

    The access settings you can apply depend on the user role you have been assigned.

    Access Setting User Roles Description
    Everyone Power User, Author All other users in the application instance can access the dashboard.
    Admin Only Admin Only Admin users can access the dashboard.
    Teams Admin, Power User, Author All users that belong to the assigned team(s) can access the dashboard. If you belong to multiple teams, you can assign the dashboard to all of the teams you belong to, or just one or more specific teams.
    Note:
    • The access settings options are displayed if your account has the Can change access settings permission applied.
    • If your account does not have this permission, the dashboard will be assigned to the teams you belong to, or if you don't belong to any teams it will be available to everyone.
    • Admins have access to all dashboards, regardless of access settings.
  5. Click Next.
  6. Click Classic Dashboards and click Next.
  7. In the Select a Template page, select Survey Responses and click Next.
  8. Select the dataset created in the previous steps and click Done.

Add a visualization tile

  1. On the Dashboards page, click the name of your new dashboard to open it.
  2. In the middle of your new dashboard, click Edit Dashboard, and then click Add > Add Visualization.
  3. In the Choose an Explore dialog, select Survey Responses.
  4. Click on the name of your survey to expand your selection, then select a survey question as a dimension.
  5. Click on Profile Variables to expand your selection, select a profile variable such as gender or age group and click Pivot.
  6. Select a Measure to represent the data as a count or percentage.
  7. Select a visualization that best represents your data.
    For more information, see Types of Visualization tiles.
  8. Customize your dashboard with colors or text.
    For more information, see Change the colors in your visualization.
  9. Click Run.
  10. Click Save.
    Result: The tile created is added to the dashboard.

Examples of tiles

The following tiles use survey responses and profile variables to present survey data with demographic data.