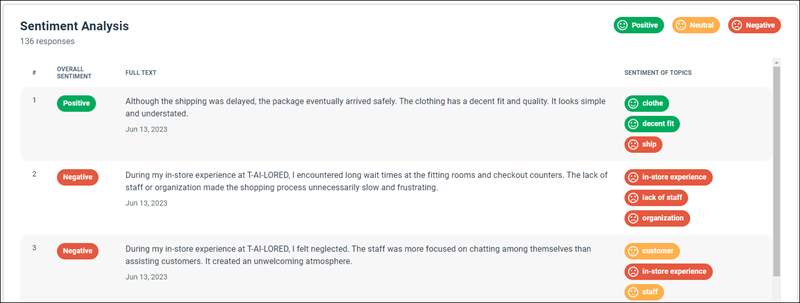
Text Analytics Table (Modern) visualization
Use this visualization type to display text analytics sentiment analysis in your dashboard.
Once the data is analyzed, it's laid out intuitively and you can filter by sentiment.
Note: Custom fields are not
supported in modern visualizations.

Tip: Customize and edit the
selected visualization type in the
Edit Tile dialog box by clicking
Edit.

| Options | Description |
|---|---|
| Title | Enter a title to display at the top of visualization. The default title is Sentiment Analysis. |
Required Dimensions
You must select specific fields for this visualization to display results.
Select all of the following dimensions:
- Completed Time > Date or [Date Field Name] > Date
- Sentiment Analysis > Full Text
- Sentiment Analysis > Topic or [Field name] - Sentiment Analytics > Topic
- Sentiment Analysis > Topic Sentiment or [Field name] - Sentiment Analytics > Topic Sentiment
- Sentiment Analysis > Overall Sentiment