Create a NPS® Classic Dashboard

Add a dashboard with configurable metrics and filters.

Customize and discover more about your NPS®1 results with configurable metrics and filters.

  1. Open the Analytics app.
  2. Create a new dashboard:
    • On the Home page, click Create a Dashboard.
    • In the Analytics navigation menu, click Dashboards and then click New Dashboard.
  3. Enter a name for your dashboard and click Next.
  4. In Set Dashboard Access Controls, specify which users can access the dashboard.

    The access settings you can apply depend on the user role you have been assigned.

    Access Setting User Roles Description
    Everyone Power User, Author All other users in the application instance can access the dashboard.
    Admin Only Admin Only Admin users can access the dashboard.
    Teams Admin, Power User, Author All users that belong to the assigned team(s) can access the dashboard. If you belong to multiple teams, you can assign the dashboard to all of the teams you belong to, or just one or more specific teams.
    Note:
    • The access settings options are displayed if your account has the Can change access settings permission applied.
    • If your account does not have this permission, the dashboard will be assigned to the teams you belong to, or if you don't belong to any teams it will be available to everyone.
    • Admins have access to all dashboards, regardless of access settings.
  5. Click Next.
  6. Click Classic Dashboards and click Next.
  7. In the Select a Template page, select NPS® Dashboard and click Next.
  8. Select a dataset from the list and then click Done.
    Net Promoter Score℠, Numeric, and Open End questions are used to create the initial dashboard.
  9. Find the results of a Net Promoter Score℠ question reflected in the following tiles templates:
    Tile Description
    NPS®

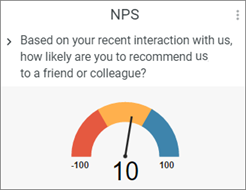
    The average NPS® of all participants. It includes the scores from all NPS® questions in the last six months and calculates the average.

    The NPS® is calculated using the following formula:

    NPS® By Category

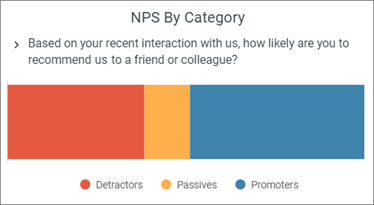
    Hover over the chart to see the number and percentage of:

    • Detractors: Participants who rated something from 0 to 6, indicating they would not recommend it.
    • Passives: Participants who rated something from 7 to 8, indicating neutral feelings.
    • Promoters: Participants who rated something from 9 to 10, indicating they would recommend it.
    NPS® Over Time

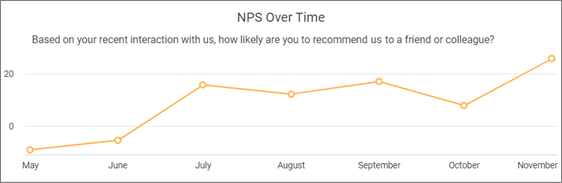
    The average NPS® over time of all participants. It takes the NPS® of each month and display it in a monthly view.

    NPS® Reasons

    The NPS® word cloud uses open end responses from the open-end questions suffixed with "words" or "text" in the Edit Tile dialog.

    The number of words used per response is counted, not amount of times the word was used in a single response.

    Hover over the word to determine the number of times the word was used.

  10. Optional: Create cross-filters to see how the data affects other variables.
  11. Add additional visualizations to the dashboard.
  12. Download the dashboard.
  13. Download a tile.
1 Net Promoter, NPS, and the NPS-related emoticons are registered U.S. trademarks, and Net Promoter Score and Net Promoter System are service marks, of Bain & Company, Inc., NICE Systems, Inc. and Fred Reichheld.