Create a Survey Classic Dashboard
A survey dashboard comes hassle-free with predefined template tiles and the ability to add custom tiles.
- An activity with a status of Pending can not be used to create a survey dashboard.
- If your survey dashboard includes data from nonmembers, the dashboard cannot be filtered by profile variables. These respondents are considered anonymous.
- Open the Surveys app, go to the Activities page, and open the survey you are interested in.
- On the activity toolbar, click Dashboard.
-
Click
New Dashboard.
-
In the dialog, give the dashboard a name.
Note: The dashboard automatically generates a name but it can be renamed.
-
Select up to 10 profile variables to add as a filter in the
dashboard.
Note: After creating the dashboard more profile variables can be added as a filter.
- Click Create.
-
In the dialog, give the dashboard a name.
-
Find the results of the data reflected.
Note:
- Tiles have the flexibility to be edited to better suit the data
- Only the first 30 questions are predefined and generated as visualizations.
The following table lists some of the best visualizations the application uses for each question type when the dashboard is created:
Question Types Visualization Single Choice - Bar
- Column
- Donut
Note: This can be created from a Pie chart visualization.
Multiple Choice - Bar
- Column
Numeric - Line
- Radial Gauge
- Single Value
Open End - Table
- Word Cloud
-
The following text analysis visualizations are created when there
are Open End questions with responses.
Please contact your Alida Customer Success representative to enable Text Analysis.
Tile Description Taxonomy 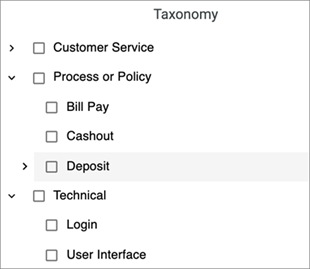
The taxonomy tile displays a list of categories Open End responses fall under. Categories are created hierarchically with multiple levels of subcategories where Open End responses are grouped together and categorized. Note: The Taxonomy tile requires the community to have a taxonomy model set up. Please contact Professional Service for more information.Sentiment Over Time 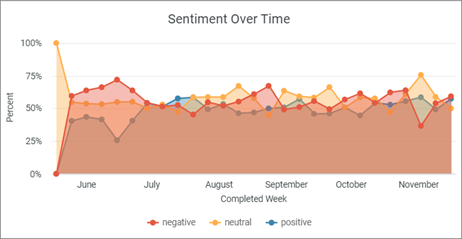
Sentiments are shown at the response level over a period of six months. Filter by sentiments to see how the sentiments shift month by month. Total Number of Text Responses 
The total number of text responses from all Open End questions. Note: The number may look inflated compared to the number of responses in NPS®1 By Category because it contains the total number of text responses from Open End questions as well.Sentiment by Category 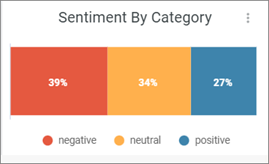
Sentiments are extracted from each Open End response at the sentence level. For example, if a response is "The product is great and easy to use.", it is categorized as positive. Key Phrase Sentiment Analysis 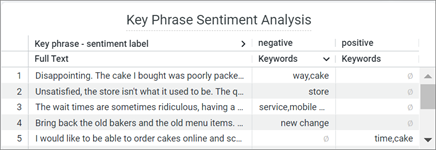
The full response is displayed along with key phrases sorted into either positive, negative, or both sentiments. The key phrases selected best describe the subject of the Open End response and multiple key phrases can be extracted from each response. For example, with a sentence such as, "The product is great! But the price is too expensive.", words like "product" will be categorized as positive and "price" as negative.
Key Phrases Word Cloud 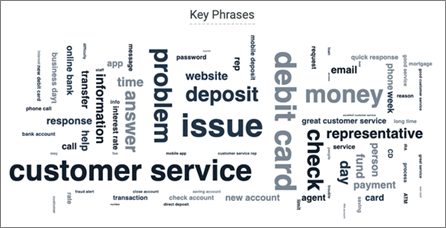
A word cloud of key phrases where the size is proportional to the frequency of the key phrase. Hover over a key phrase to see how many times it has been used overall. A key phrase is counted every time it is mentioned. For example, if the key phrase "issue" is mentioned three times in one sentence it will count three times.
Sentiment By Key Phrase 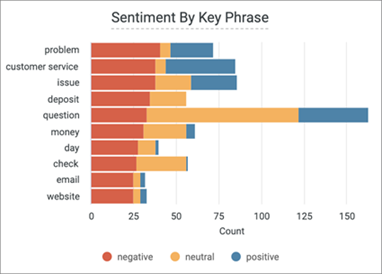
The top ten most frequent key phrases found in Open Ends are broken down by sentiments. Sentiments are split into three categories, positive, neutral, and negative. Hover over each sentiment to see how many times a key phrase is mentioned.
Note: Recall, a measure of the completeness of the analysis, is less than 100%. This means that not all key phrases can be clearly associated with a sentiment. For example, the algorithm may not assign the phrase "riot police" a negative sentiment, even though a human likely would. Only key phrases successfully associated with a sentiment will be displayed.Note: If Text Analysis is enabled there is no limit to the number of questions used in Text Analysis visualizations. - Optional:
Add text analysis visualizations to an existing Surveys dashboard.
Note:
- Text analysis is not enabled automatically, and predefined tiles will not appear in any dashboards created prior to its enablement. However, text analysis tiles can be added manually.
- Any dashboards created after the enablement of text analysis will have predefined text analysis tiles.
- Click the Options button on the top right of the page, and in the drop-down menu, click Edit Dashboard.
- Click Add Tile > Visualization.
- In the Choose an Explore dialog, select the data source Text Analytics Responses.
- In the All Fields section on the left of the dialog, expand the Survey section.
-
Select the following options to create the following
visualizations.
Options Description Sentiment Over Time - Under
Dimensions, expand the:
- Completed Date dimension and select Week.
- Text Analysis dimension and select Full text - Sentiment Label.
- Click Pivot next to Full text - Sentiment Label.
- Under Measures, select Percent.
- In the Visualization section, select Line.
- On the
right of the dialog, click the
Edit button to customize the
visualization:

- In the Series tab, under the Points section select Filled.
- In the Series tab, expand each option and change the Type to Area.
- In the Values tab, select Value Labels.
Total Number of Text Responses - Under Measures, expand the Text Analysis dimension and select Full text - Response Count.
- In the Visualization section, select Single Value.
- On the
right of the dialog, click the
Edit button and then the
Style tab.

- Under Title Override, enter "Total Number of Text Responses".
Sentiment By Category - Under Dimensions, expand the Text Analysis dimension and select Full text - Sentiment Label.
- Click Pivot next to Full text - Sentiment Label.
- Under Measures, expand the Text Analysis measure, and select Full text - Response Percent.
- In the Visualization section, select Bar.
- On the
right of the dialog, click the
Edit button to customize the
visualization:

- In the Plot tab, select Stacked.
- In the Values tab, select Value Labels.
Key Phrase Sentiment Analysis - Under
Dimensions, expand the
Text Analysis dimension and
select both:
- Full Text
- Key phrase - sentiment label
- Next to
Key phrase - sentiment label:
- Click Pivot.
- Click Filter, and then select "contains" and the fields "negative" and "positive."
- Under Measures, expand the Text Analysis measure, and select Key phrase - text concat.
- In the Visualization section, select Table.
Key Phrases Word Cloud - Under Dimensions, expand the Text Analysis dimension and select Key phrase - text.
- Under Measures, click Key phrase - count with duplicates.
- In the
Visualization section, click
the
Options button and select
Word Cloud.

Sentiment By Key Phrases - Under
Dimensions, expand the
Text Analysis dimension and
select both:
- Key phrase - sentiment label
- Key phrase - text
- Click Pivot next to Key phrase - sentiment label.
- Under Measures, click Count.
- In the Visualization section, select Bar.
- On the
right of the dialog, click the
Edit button and in the
Plot tab select
Stacked.

- Under
Dimensions, expand the:
- Click Run.
- Click Save.
-
If your survey includes test data and incomplete responses, you
can filter out this information from your dashboard:
-
Click the
Options button on the top right of the
page and then, click
Edit dashboard.

- Select Filters > Add Filters.
-
To filter out test data, enter
DatasetType in the
Filter by text box and select the field
from the results. In the
Configure Default Value list select the
Live checkbox, and click
Add.
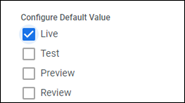
- To filter out incomplete survey responses, enter ResponseStatus in the Filter by text box and select the field from the results. In the Configure Default Value list select the Completed checkbox, and click Add.
- Click Save.
-
Click the
Options button on the top right of the
page and then, click
Edit dashboard.
-
Use the existing filters for a refined view of the dashboard.

- Optional: Create cross-filters to see how the data affects other variables. Create cross-filters to see how the data affects other variables.
- Add visualizations and additional visualizations to the dashboard. Add visualizations and additional visualizations to the dashboard.
- Download the dashboard. Download the dashboard.
- Download a tile.Download a tile.
- Optional:
Navigate back to the
Dashboard tab within your survey to specify
which users can access the dashboard.
-
Click the
Options menu and select
Access Settings.

-
In the
Access Settings dialog update the settings
for the dashboard and click
Save.
The access settings you can apply depend on the user role you have been assigned.
Access Setting User Roles Description Everyone Power User, Author All other users in the application instance can access the dashboard. Admin Only Admin Only Admin users can access the dashboard. Teams Admin, Power User, Author All users that belong to the assigned team(s) can access the dashboard. If you belong to multiple teams, you can assign the dashboard to all of the teams you belong to, or just one or more specific teams. Note:- The access settings options are displayed if your account has the Can change access settings permission applied.
- If your account does not have this permission, the dashboard will be assigned to the teams you belong to, or if you don't belong to any teams it will be available to everyone.
- Admins have access to all dashboards, regardless of access settings.
-
Click the
Options menu and select
Access Settings.