Viewing and using dashboards
If you are an end-user of a dashboard, you have options for configuring your view of the dashboard.
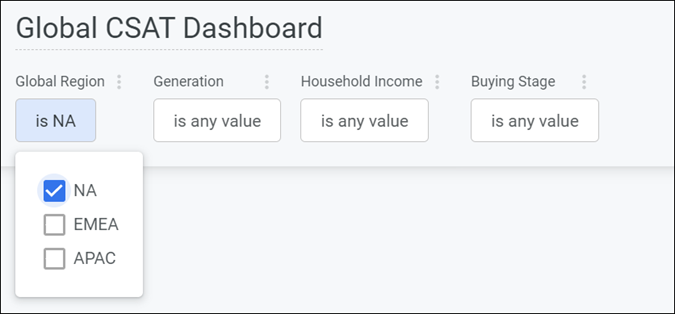
Using predefined filters
Dashboards may include predefined filters that you can use to adjust the data displayed to only include what you are interested in. For example, you may be able to narrow down your organizations data to the region you are located in to get a view of the dashboard that is more relevant to your needs.
Cross-filtering
You can use cross-filtering to interact with the dashboard data and configure the results you see. Cross-filtering allows you to click or select an area in a visualization, and all related dashboard tiles automatically update to filter based on that value. For more information, see Cross-filtering dashboards.
Refreshing the dashboard
Typically, you also have the option to refresh the data displayed in the dashboard at any time.
Downloading dashboards and tiles
Sharing
If you have the appropriate permissions, you can also share the dashboard with internal and external users by creating a shareable link. You can set an expiration date that determines how long the link is valid for.
For more information, see Share a dashboard.